News
Wed, 08. Feb 2017 Beck, Fabian
How Scientists Integrate Text and Visualization
New publication of the research group appears in the renowned journal TVCG and will be presented at the international conference PacificVis 2017 in South Korea.
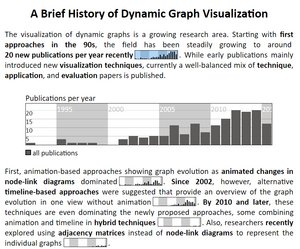
Since the beginning of scientific publishing, researchers use figures to illustrate their papers. These figures provide details and report underlying data. As a new form of figure, in 2006, researcher and designer Edward Tufte presented spraklines. Authors may use these small graphics, which have about the size of a word, in text and tables, much like a word. But do researchers already leverage this technique in their publications? We address this research question in our current publication and survey existing literature across scientific disciplines. We not only report current usage scenarios of word-sized graphics, but also suggest new ideas how to make use of these graphics in scientific publications. We see particular potential for improving communication of scientific results when integrating the graphics into interactive documents. Finally, we call the visualization community to become a pioneer in innovative use of figures and graphics in their publication and to establish standards for interactive documents. The collected literature is available in an interactive literature browser. In a web-based example we demonstrate the interactive connection between figures, word-sized graphics, and text. Our paper was accepted at the international visualization conference PacificVis 2017 in Seoul, South Korea where we present our work in April. As one of the best accepted submissions of the conference, our paper will additionally appear in the renowned Journal for visualization and computer graphics TVCG. The work is part of the project Vis-Text Interaction, funded by Baden-Württemberg Stiftung. More information:
