The Research Group is Moving!
During winter term 2021/22, we move to University of Bamberg. From Oct. 15, 2021, Fabian Beck holds a full professor position on Information Visualization.
New webpage of the research group: https://www.uni-bamberg.de/vis
Publications
Publications of the research group since 2016. For earlier publications, please visit Fabian Beck's Google Scholar or DBLP profile.

Type of Publication: Article in Journal
Interactive Map Reports Summarizing Bivariate Geographic Data
- Author(s):
- Latif, Shahid; Beck, Fabian
- Title of Journal:
- Visual Informatics
- Volume (Publication Date):
- 3 (2019)
- Number of Issue:
- 1
- pages:
- 27-37
- Keywords:
- Geographic visualization, natural language generation, interactive documents
- Digital Object Identifier (DOI):
- doi:10.1016/j.visinf.2019.03.004
- Fulltext:
- Interactive Map Reports Summarizing Bivariate Geographic Data (1.41 MB)
- Citation:
- Download BibTeX
Abstract
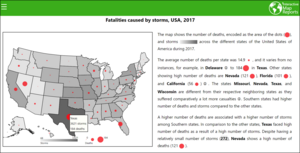
Bivariate map visualizations use different encodings to visualize two variables but comparison across multiple encodings is challenging. Compared to a univariate visualization, it is significantly harder to read regional differences and spot geographical outliers. Especially targeting inexperienced users of visualizations, we advocate the use of natural language text for augmenting map visualizations and understanding the relationship between two geo-statistical variables. We propose an approach that selects interesting findings from data analysis, generates a respective text and visualization, and integrates both into a single document. The generated reports interactively link the visualization with the textual narrative. Users can get additional explanations and have the ability to compare different regions. The text generation process is flexible and adapts to various geographical and contextual settings based on small sets of parameters. We showcase this flexibility through a number of application examples.
