The Research Group is Moving!
During winter term 2021/22, we move to University of Bamberg. From Oct. 15, 2021, Fabian Beck holds a full professor position on Information Visualization.
New webpage of the research group: https://www.uni-bamberg.de/vis
Publications
Publications of the research group since 2016. For earlier publications, please visit Fabian Beck's Google Scholar or DBLP profile.

Type of Publication: Article in Collected Edition
Performance Evolution Matrix: Visualizing Performance Variations along Software Versions
- Author(s):
- Sandoval Alcocer, Juan Pablo; Beck, Fabian; Bergel, Alexandre
- Title of Anthology:
- Proceedings of the 2019 Working Conference on Software Visualization
- Publisher:
- IEEE
- Publication Date:
- 2019
- Digital Object Identifier (DOI):
- doi:10.1109/VISSOFT.2019.00009
- Fulltext:
- Performance Evolution Matrix: Visualizing Performance Variations along Software Versions (545 KB)
- Citation:
- Download BibTeX
Abstract
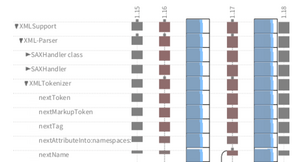
Software performance may be significantly affected by source code modifications. Understanding the effect of these changes along different software versions is a challenging and necessary activity to debug performance failures. It is not sufficiently supported by existing profiling tools and visualization approaches. Practitioners would need to manually compare calling context trees and call graphs. We aim at better supporting the comparison of benchmark executions along multiple software versions. We propose Performance Evolution Matrix, an interactive visualization technique that contrasts runtime metrics to source code changes. It combines a comparison of time series data and execution graphs in a matrix layout, showing performance and source code metrics at different levels of granularity. The approach guides practitioners from the high-level identification of a performance regression to the changes that might have caused the issue. We conducted a controlled experiment with 12 participants to provide empirical evidence of the viability of our method. The results indicate that our approach can reduce the effort for identifying sources of performance regressions compared to traditional profiling visualizations.
Received the VISSOFT 2019 Best Paper Award
