The Research Group is Moving!
During winter term 2021/22, we move to University of Bamberg. From Oct. 15, 2021, Fabian Beck holds a full professor position on Information Visualization.
New webpage of the research group: https://www.uni-bamberg.de/vis
Publications
Publications of the research group since 2016. For earlier publications, please visit Fabian Beck's Google Scholar or DBLP profile.

Type of Publication: Article in Journal
Visualizing Dynamic Hierarchies in Graph Sequences
- Author(s):
- Vehlow, Corinna; Beck, Fabian; Weiskopf, Daniel
- Title of Journal:
- IEEE Transactions on Visualization and Computer Graphics
- Volume (Publication Date):
- 22 (2016)
- Number of Issue:
- 10
- pages:
- 2343-2357
- Digital Object Identifier (DOI):
- doi:10.1109/TVCG.2015.2507595
- Fulltext:
- Visualizing Dynamic Hierarchies in Graph Sequences (10.49 MB)
- Citation:
- Download BibTeX
Abstract
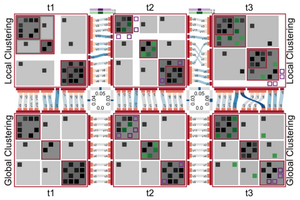
Graphs are used to model relations between objects, where these objects can be grouped hierarchically based on their connectivity. In many applications, the relations change over time and so does the hierarchical group structure. We developed a visualization technique that supports the analysis of the topology and the hierarchical group structure of a dynamic graph and the tracking of changes over time. Each graph of a sequence is visualized by an adjacency matrix, where the hierarchical group structure is encoded within the matrix using indentation and nested contours, complemented by icicle plots attached to the matrices. The density within and between subgroups of the hierarchy is represented within the matrices using a gray scale. To visualize changes, transitions and dissimilarities between the hierarchically structured graphs are shown using a flow metaphor and color coding. The design of our visualization technique allows us to show more than one hierarchical group structure of the same graph by stacking the sequences, where hierarchy comparison is supported not only within but also between sequences. To improve the readability, we minimize the number of crossing curves within and between sequences based on a sorting algorithm that sweeps through the sequences of hierarchies.
