Die Arbeitsgruppe zieht um!
Wir wechseln im Wintersemester 2021/22 an die Universität Bamberg. Ab 15. Oktober 2021 übernimmt Fabian Beck den dortigen Lehrstuhl für Informationsvisualisierung.
Neue Webseite der Arbeitsgruppe: https://www.uni-bamberg.de/vis
Publikationen
Publikationen der Arbeitsgruppe, die seit 2016 erschienen sind. Frühere Publikationen von Fabian Beck sind auf Google Scholar oder DBLP zu finden.

Art der Publikation: Beitrag in Sammelwerk
A Design and Application Space for Visualizing User Sessions of Virtual and Mixed Reality Environments
- Autor(en):
- Agarwal, Shivam; Auda, Jonas; Schneegaß, Stefan; Beck, Fabian
- Titel des Sammelbands:
- Proceedings of Vision, Modeling, and Visualization
- Verlag:
- The Eurographics Association
- Veröffentlichung:
- 2020
- ISBN:
- 978-3-03868-123-6
- Digital Object Identifier (DOI):
- doi:10.2312/vmv.20201194
- Volltext:
- A Design and Application Space for Visualizing User Sessions of Virtual and Mixed Reality Environments (1,35 MB)
- Vortrag zu dieser Publikation:
- Vision, Modeling, and Visualization 2020
- Aufzeichnung:
- https://www.youtube.com/watch?v=hUenXnU5Adk
- Zitation:
- Download BibTeX
Kurzfassung
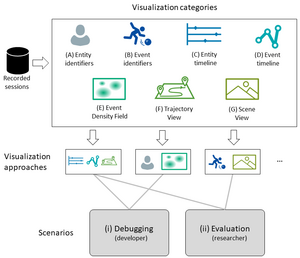
Virtual and mixed reality environments gain complexity due to the inclusion of multiple users and physical objects. A core challenge for developers and researchers while analyzing sessions from such environments lies in understanding the interaction between entities. Additionally, the raw data recorded from such sessions is difficult to analyze due to the simultaneous temporal and spatial changes of multiple entities. However, similar data has already been visualized in other areas of application. We analyze which aspects of these related visualizations can be leveraged for analyzing user sessions in virtual and mixed reality environments and describe a design and application space for such visualizations. First, we examine what information is typically generated in interactive virtual and mixed reality applications and how it can be analyzed through such visualizations. Next, we study visualizations from related research fields and derive seven visualization categories. These categories act as building blocks of the design space, which can be combined into specific visualization systems. We also discuss the application space for these visualizations in debugging and evaluation scenarios. We present two application examples that showcase how one can visualize virtual and mixed reality user sessions and derive useful insights from them.
