Die Arbeitsgruppe zieht um!
Wir wechseln im Wintersemester 2021/22 an die Universität Bamberg. Ab 15. Oktober 2021 übernimmt Fabian Beck den dortigen Lehrstuhl für Informationsvisualisierung.
Neue Webseite der Arbeitsgruppe: https://www.uni-bamberg.de/vis
Publikationen
Publikationen der Arbeitsgruppe, die seit 2016 erschienen sind. Frühere Publikationen von Fabian Beck sind auf Google Scholar oder DBLP zu finden.

Art der Publikation: Beitrag in Sammelwerk
Visual Analytics for Decomposing Temporal Event Series of Production Lines
- Autor(en):
- Herr, Dominik; Beck, Fabian; Ertl, Thomas
- Titel des Sammelbands:
- Proceedings of the 22nd International Conference on Information Visualisation
- Veröffentlichung:
- 2018
- Volltext:
- Visual Analytics for Decomposing Temporal Event Series of Production Lines (2,04 MB)
- Zitation:
- Download BibTeX
Kurzfassung
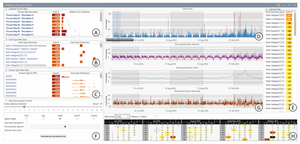
The temporal analysis of events in a production line helps manufacturing experts get a better understanding of the line's performance and provides ideas for improvement. Especially the identification of recurring error patterns is important, because these patterns can be an indicator of systematic production issues. We present a visual analytics approach to analyze event reports of a production line. Reported events are shown as a time series plot that can be decomposed into a trend, seasonal, and remainder component by applying Seasonal Trend decomposition using Loess (STL). To find specific event patterns, the data is filtered based on aspects such as the event description or the processed product. Identified temporal patterns can be extracted from the original event series and compared visually with each other. In addition to predefined settings, experts can define a subseries of the event series and the period length of STL's seasonal component through an automatically optimized brushing of the undecomposed plot. We developed the approach together with an industry partner. To evaluate our approach, we conducted two pair analytics sessions with our industry partner's experts.
We demonstrate use cases from these sessions that showcase our approach's analytical potential. Moreover, we present general expert feedback that we collected through semi-structured interviews after the pair analytics sessions.
