Die Arbeitsgruppe zieht um!
Wir wechseln im Wintersemester 2021/22 an die Universität Bamberg. Ab 15. Oktober 2021 übernimmt Fabian Beck den dortigen Lehrstuhl für Informationsvisualisierung.
Neue Webseite der Arbeitsgruppe: https://www.uni-bamberg.de/vis
Publikationen
Publikationen der Arbeitsgruppe, die seit 2016 erschienen sind. Frühere Publikationen von Fabian Beck sind auf Google Scholar oder DBLP zu finden.

Art der Publikation: Beitrag in Zeitschrift
Visualizing Group Structures in Graphs: a Survey
- Autor(en):
- Vehlow, Corinna; Beck, Fabian; Weiskopf, Daniel
- Titel der Zeitschrift:
- Computer Graphics Forum
- Jahrgang (Veröffentlichung):
- 36 (2017)
- Heftnummer:
- 6
- Seiten:
- 201-225
- Digital Object Identifier (DOI):
- doi:10.1111/cgf.12872
- Volltext:
- Visualizing Group Structures in Graphs: a Survey (4,91 MB)
- Zitation:
- Download BibTeX
Kurzfassung
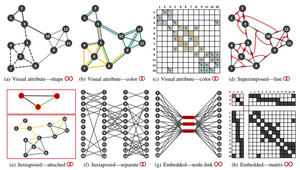
Graph visualizations encode relationships between objects. Abstracting the objects into group structures provides an overview of the data. Groups can be disjoint or overlapping, and might be organized hierarchically. However, the underlying graph still needs to be represented for analyzing the data in more depth. This work surveys research in visualizing group structures as part of graph diagrams. A particular focus is the explicit visual encoding of groups, rather than only using graph layout to indicate groups implicitly. We introduce a taxonomy of visualization techniques structuring the field into four main categories: visual node attributes vary properties of the node representation to encode the grouping, juxtaposed approaches use two separate visualizations, superimposed techniques work with two aligned visual layers, and embedded visualizations tightly integrate group and graph representation. The derived taxonomies for group structure and visualization types are also applied to group visualizations of edges. We survey group-only, group–node, group–link, and group–network tasks that are described in the literature as use cases of group visualizations. We discuss results from evaluations of existing visualization techniques as well as main areas of application. Finally, we report future challenges based on interviews we conducted with leading researchers of the field.
