Die Arbeitsgruppe zieht um!
Wir wechseln im Wintersemester 2021/22 an die Universität Bamberg. Ab 15. Oktober 2021 übernimmt Fabian Beck den dortigen Lehrstuhl für Informationsvisualisierung.
Neue Webseite der Arbeitsgruppe: https://www.uni-bamberg.de/vis
Publikationen
Publikationen der Arbeitsgruppe, die seit 2016 erschienen sind. Frühere Publikationen von Fabian Beck sind auf Google Scholar oder DBLP zu finden.

Art der Publikation: Beitrag in Zeitschrift
Exploranative Code Quality Documents
- Autor(en):
- Mumtaz, Haris; Latif, Shahid; Beck, Fabian; Weiskopf, Daniel
- Titel der Zeitschrift:
- IEEE Transactions on Visualization and Computer Graphics
- Jahrgang (Veröffentlichung):
- 26 (2020)
- Heftnummer:
- 1
- Seiten:
- 1129-1139
- Schlagworte:
- Code quality, interactive documents, natural language generation, sparklines
- Digital Object Identifier (DOI):
- doi:10.1109/TVCG.2019.2934669
- Volltext:
- Exploranative Code Quality Documents (2,22 MB)
- Vortrag zu dieser Publikation:
- IEEE VIS 2019
- Aufzeichnung:
- https://vimeo.com/370669433
- Zitation:
- Download BibTeX
Kurzfassung
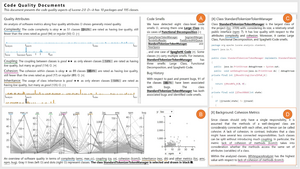
Good code quality is a prerequisite for efficiently developing maintainable software. In this paper, we present a novel approach to generate exploranative (explanatory and exploratory) data-driven documents that report code quality in an interactive, exploratory environment. We employ a template-based natural language generation method to create textual explanations about the code quality, dependent on data from software metrics. The interactive document is enriched by different kinds of visualization, including parallel coordinates plots and scatterplots for data exploration and graphics embedded into text. We devise an interaction model that allows users to explore code quality with consistent linking between text and visualizations; through integrated explanatory text, users are taught background knowledge about code quality aspects. Our approach to interactive documents was developed in a design study process that included software engineering and visual analytics experts. Although the solution is specific to the software engineering scenario, we discuss how the concept could generalize to multivariate data and report lessons learned in a broader scope.
